#WSQ13

--Originally published at OlafGC / Class #TC1017

Hi guys! This is the last post I’ll write, to show you a magic, new and wonderful tool that Ken shared with us. It is called Scilab, and it’s just amazing. It does almost literally everything (except writing your posts for Ken’s class). The link for the video is bellow, and enjoy this, my last post!


WSQ 13 “SciLab”

--Originally published at blog de Horacio

Scilab es un paquete de computación numérico de código abierto y multiplataforma y un lenguaje de programación orientado numéricamente de alto nivel. Puede usarse para el procesamiento de señales, análisis estadístico, mejora de imágenes, simulaciones de dinámica de fluidos, optimización numérica y modelado, simulación de sistemas dinámicos explícitos e implícitos y manipulaciones simbólicas (si la caja de herramientas correspondiente está instalada).

Fuente: https://en.wikipedia.org/wiki/Scilab. Sí, usé Wikipedia. No estaba de humor para hacer una larga investigación para definir Scilab.

De acuerdo. Comencemos con la publicación del blog.

Scilab es una herramienta realmente útil que me ayudará a partir de ahora a hacer mis cálculos matemáticos. Además no soy muy bueno en matemáticas, Es divertido usar un software de matemáticas con el conocimiento de programación que ya tenemos.

El próximo martes es mi examen final de matemáticas. Definitivamente estoy usando esto para revisar mis ejercicios mientras estudio.
Captura de pantalla 2017-05-07 a la(s) 21.56.37

SciLab

--Originally published at my programming blog

The last WSQ was to use SciLab for data analysis and to display data for example in charts.

This time I’m not going to explain each thing step by step because there is a pdf that explains everything I will do.

you can make a lot of things like: Obtain the sine, cosine, logarithm etc. of a number, also you can make functions which start with “function” and end with “endoffucntion” and it is very similar to c++.

So this is an example of what I learned with SchiLab of data analysis:

Screen Shot 2017-05-01 at 11.31.23 PM

Here I did an analysis if the vectors had equal values, I did a sequence from 20 to 10 where each time there is a -2 (is a loop) and I obtained the value of e/2.

Example of a graph:

Screen Shot 2017-05-01 at 11.39.11 PM

I graphed this curve and the linspace is where you put values where the value of x is the smallest, the biggest and the number of values calculated  between them.


#WSQ13 SciLab 16/04/17

--Originally published at Solving Problems with Programming

scilabp (1)

Link of picture

So in this fourteen week class I started with doing this WSQ13 and I started reviewing in creating and calling functions in C++.#Mastery06, #Mastery07, #Mastery16 Use of recursion for repetitive algorithms, #Mastery17 When to use what type of repetition in a program, #Mastery18 Creation and use of Arrays/ Vectors in C++. Furthermore, in this stage I have all the topics of the course from 1 to 24.

What I did for this numeric program is using Scilab. Scilab is a great tool that I believe I will find very useful during the rest of my degree programs and beyond. The motivation here is simply to introduce me to the tool. Scilab is open source software and runs on Linux, Mac and Windows

Please download and “play with” SciLab.

The resources I need it to play with Scilab are:

Download the latest version at http://www.scilab.org/download/latest

Please follow the tutorial available on their website under Resources->Documentation. Here is the direct link to the tutorial http://www.scilab.org/content/download/849/7901/file/Scilab_beginners.pdf

Page for SciLab to download at https://www.scilab.org

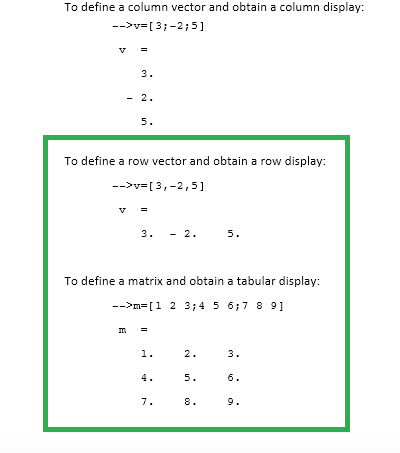
SciLab is an incredibly useful software used to perform ALL mathematical calculations, plots AND even control Microcontrollers!!. It works using commands from the Matlab software and you can also play with this software . As explained in their introductory document:

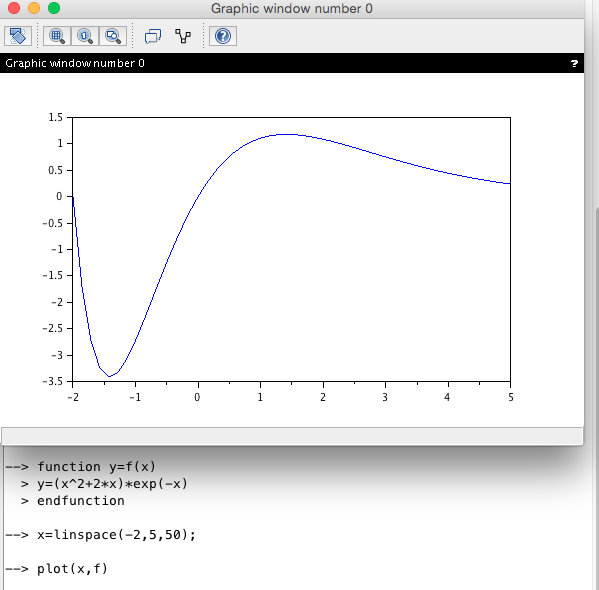
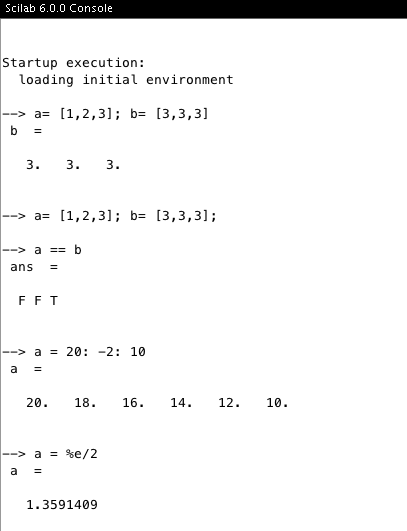
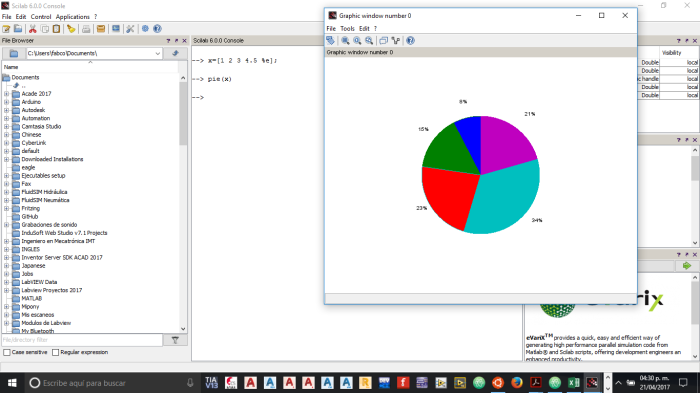
As we can see in the next pictures we have the #Mastery23 Data analysis with tools (to be determined which tool, most likely SciLab) and #Mastery24 Visualization of data with tools where we have a command to give a value to a variable and using the command plot for graphics we can see the behaviour of that variable of the graphic. For example, if we have these commands:

>> x=0: pi/100: 2*pi;% son los valores del inicio en cero luego el incremento es pi/100

sin x and cos x
surf
pieee
Continue reading "#WSQ13 SciLab 16/04/17"