#WSQ10 LISTS

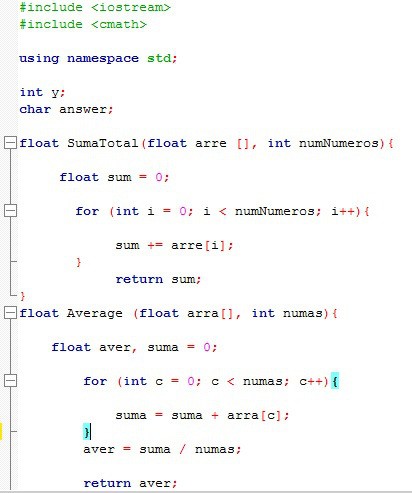
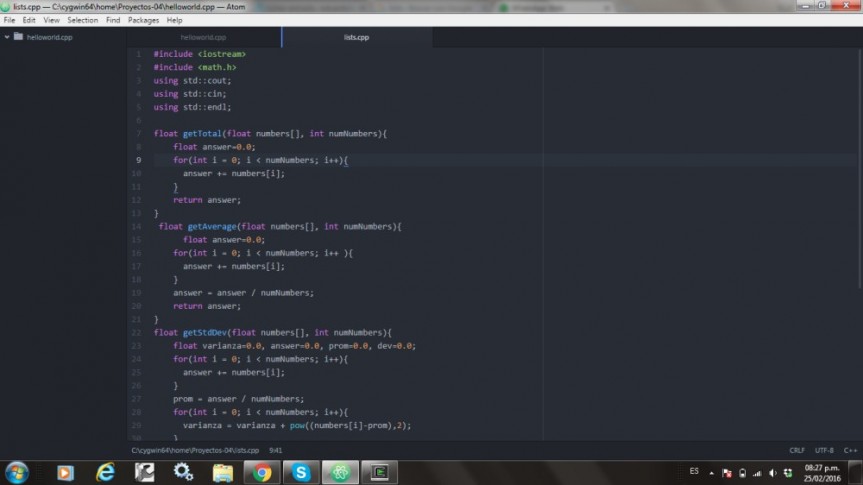
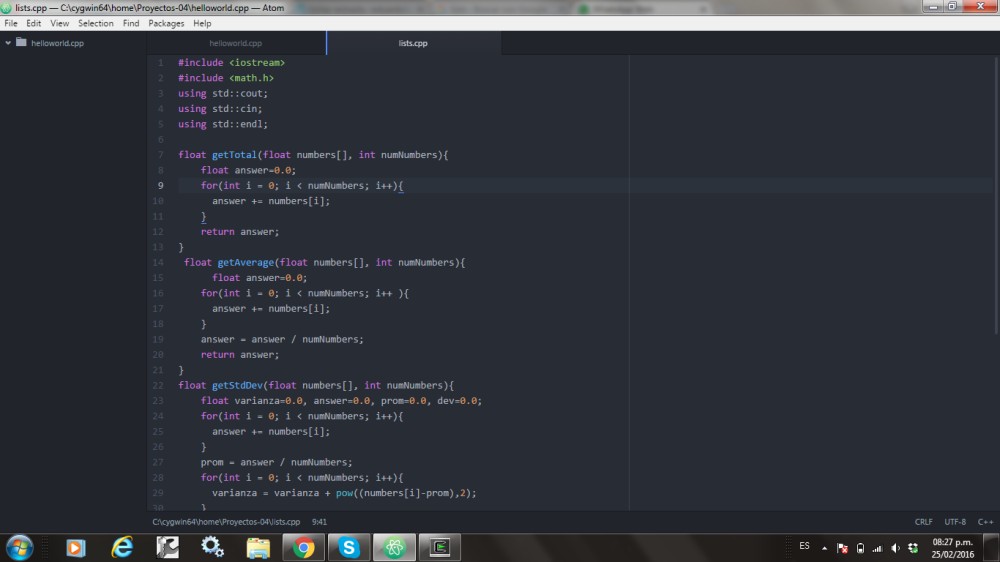
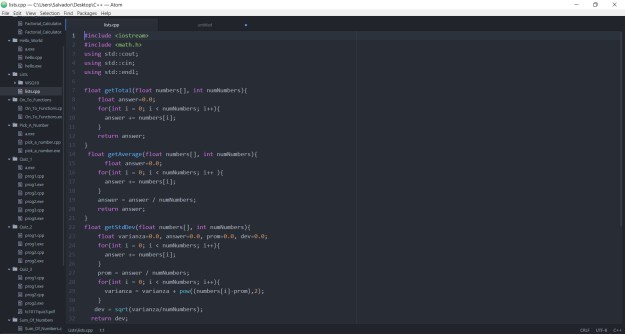
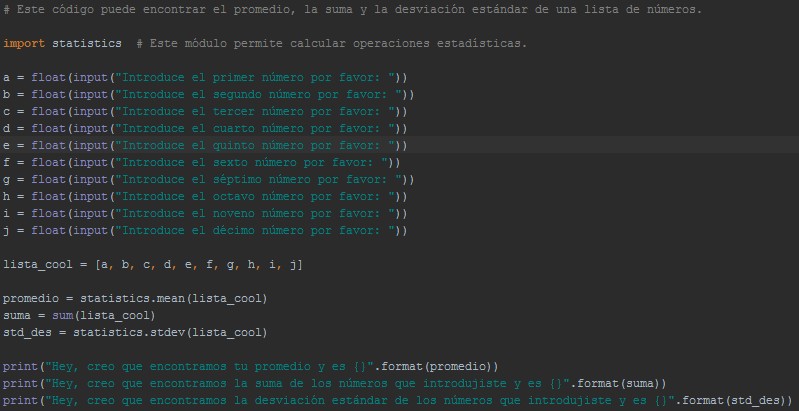
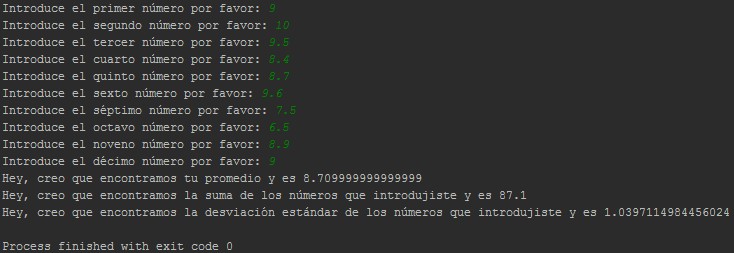
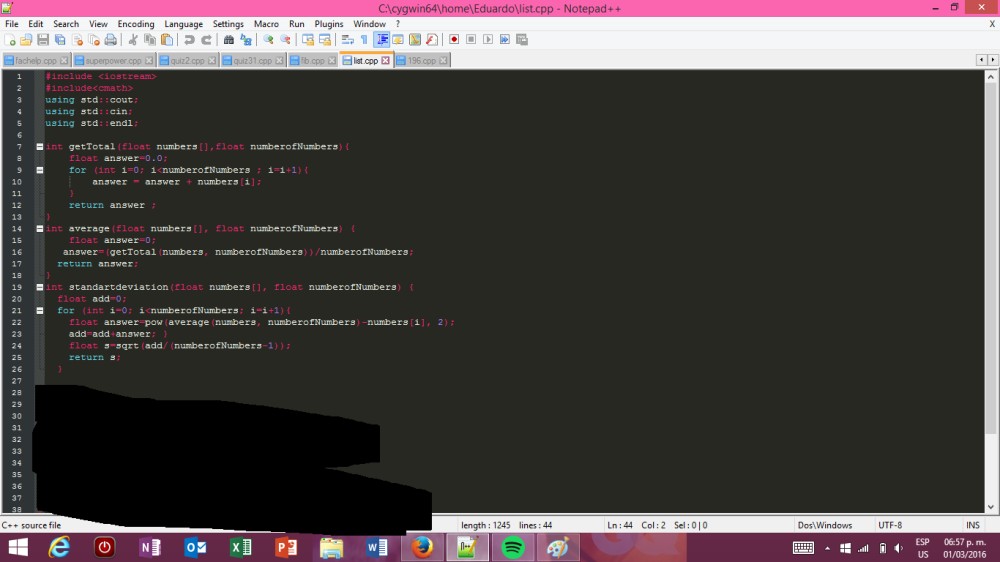
Well for this WSQ we had to create a list of numbers where the user inputs 10 numbers, and from there you must add them all, get the average, and get the standard deviation. But fiest Mr. Bauer ask us why we uses “namespace std” if we didn’t know what that meant, therefore he showed us that we should use what we know, in this case “include std::cout,cin, endl” so that’s what we did. And he also gave us the first Function we needed for the program.Screenshot13.1

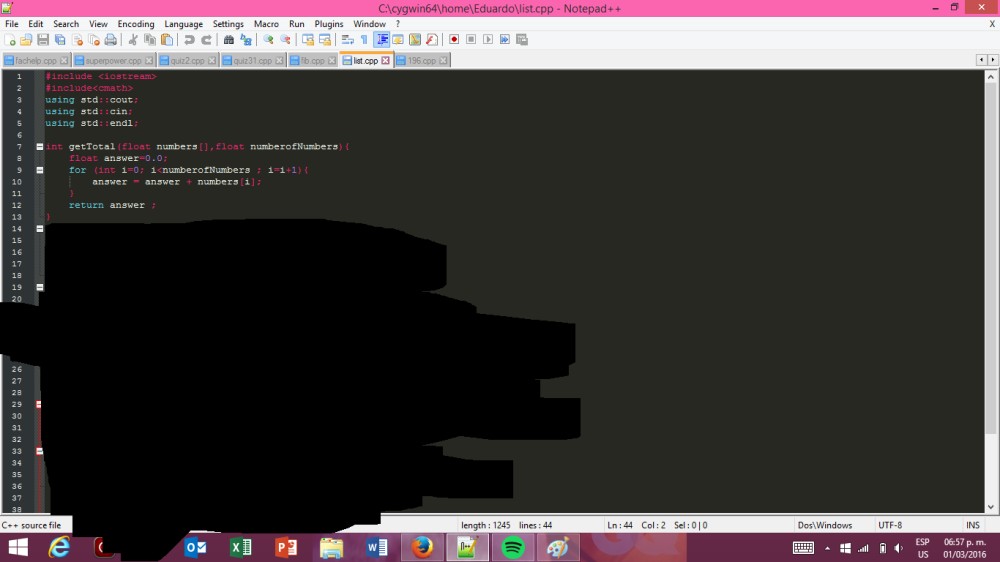
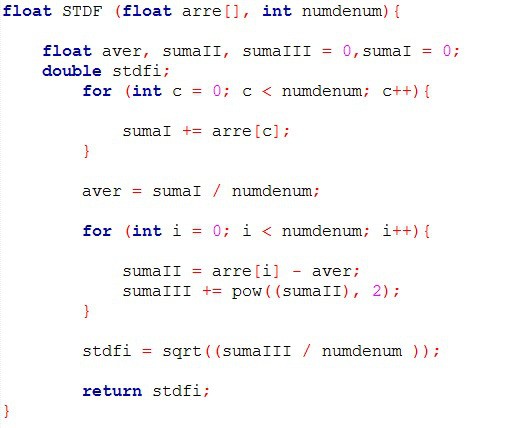
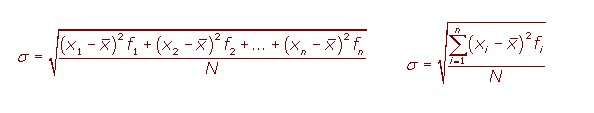
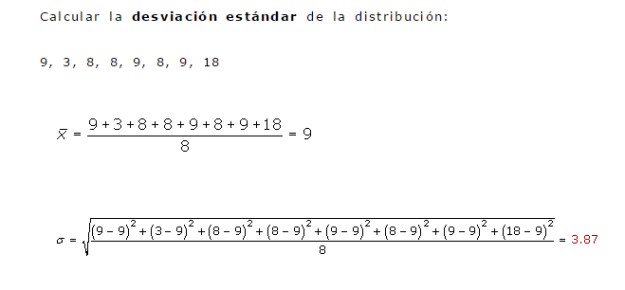
from the first function we had to imagine how the 2nd and 3rd would look like, I wondererd for so long until I went onto my m8 Dario’s blog, and checked if he had done another function for the average, which was the case, but contrary of what I had thought, he used last function in the new function so he didn’t have to add the numbers again. And for the standard deviation we had to do one Function totally different.

Screenshot13.2.png

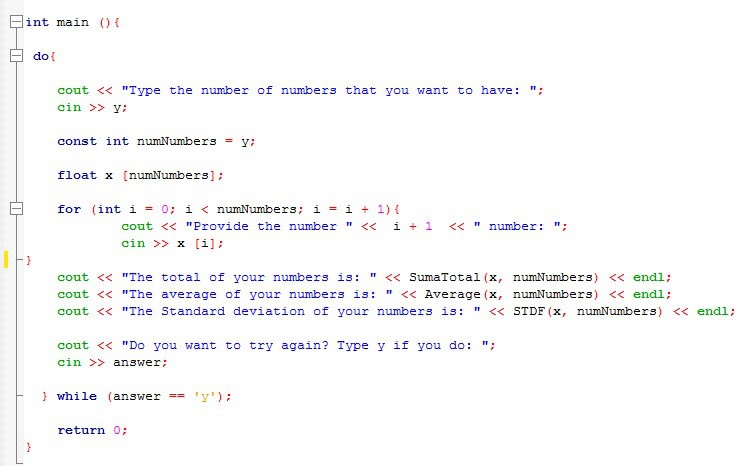
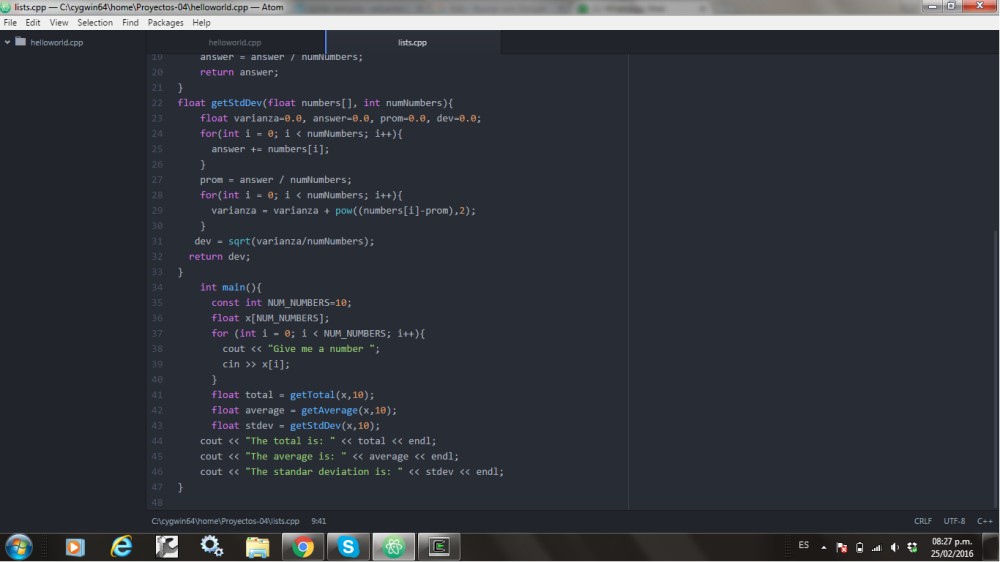
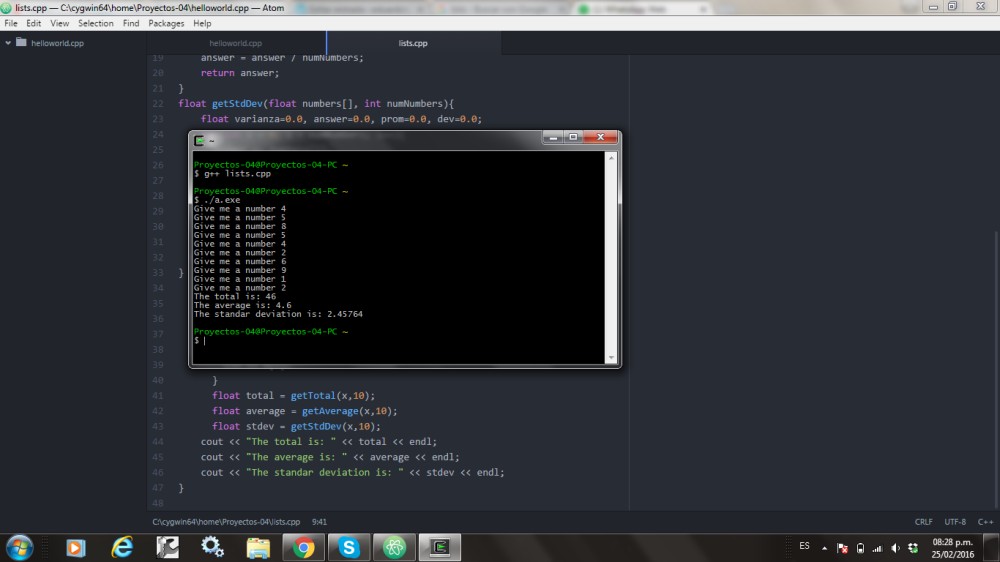
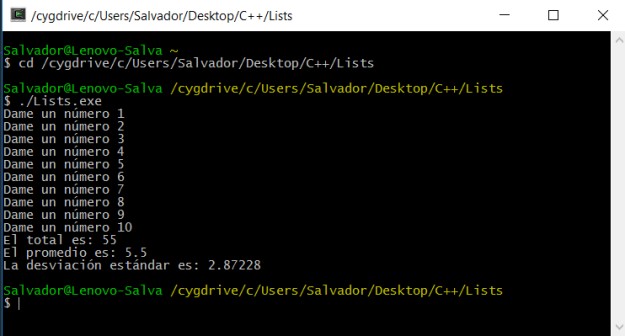
Finally the main was easier that all, you just had to put all the variables on the float, add a constant for the Numbers and say that the number to be inputed would be until it became equal to 10 (i=10) so each time a number would be inputed, the counter would go (i++).

The you just have to print the answers, using the functions with the variables (x, numberofNumbers) and end, between each line.Screenshot13.3

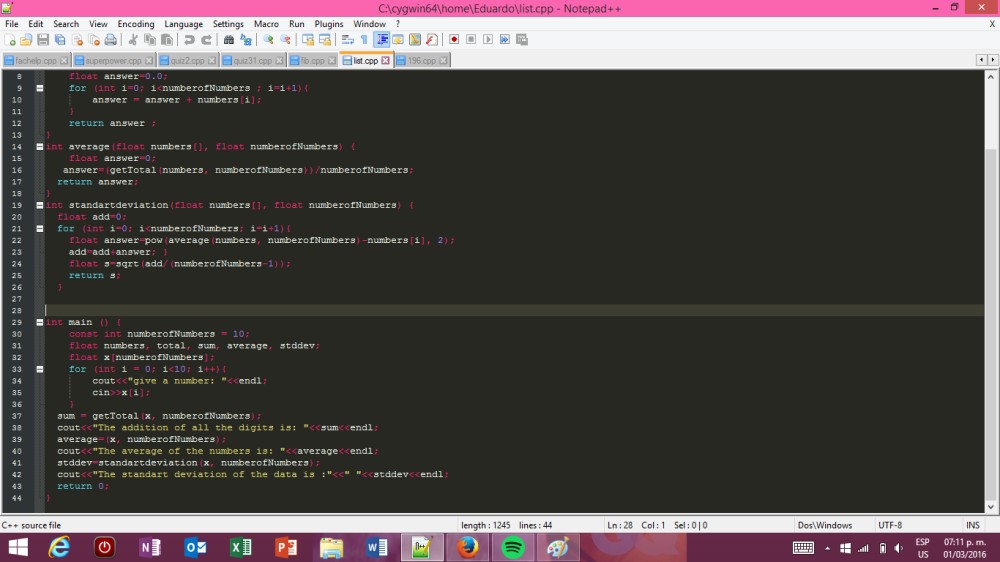
Here is my code in case you might need it.


Vectors are AWSOME!!!

Hello again, This blog is specifically dedicated to explain vectors since Ken already taught us how to use arrays. Vector are pretty cool, you can do a lot of things with them. This video show some of the things you can do with them. The video is pretty long but, all the important information is in the first 8 minutes.

Check out this PAGE so that you know how to do the standard deviation and what it is. The page is MathIsFun. Pretty nice website 🙂.

Of course I can’t forget the code:

List with arrays

List with vectors

Tutorial on vectors

YOU KNOW WHAT I’m gonna add some extra code, I was able to make a list of vector strings that organizes itself in alphabetical order. Here it is: List of organizable strings. For this code, I got help from this book: 

book

Here is my tutorial for vectors:

Made by Orlando Lara

Standard deviation calculator

THIS BLOGPOST IS  NOT DONE YET, BUT STILL YOU CAN ALREADY TAKE A LOOK AT THE CODE, WHICH IS AT THE END. For the task number ten of the semester, we were asked to create program that asks the user for 10 numbers. We were required to store those numbers in a list and to show the user the total, average and standard deviation of those numbers.

The easiest way to this was to create an array for those numbers. An array is just a group of numbers saved by the computer. You can acces any of those numbers WSQ10_functions1WSQ10_STDFfunctionsWSQ10_main

#include <iostream>
#include <cmath>

using namespace std;

int y;
char answer;

float SumaTotal(float arre [], int numNumeros){

float sum = 0;

for (int i = 0; i < numNumeros; i++){

sum += arre[i];
}
return sum;
}
float Average (float arra[], int numas){

float aver, suma = 0;

for (int c = 0; c < numas; c++){

suma = suma + arra[c];
}

aver = suma / numas;

return aver;
}
float STDF (float arre[], int numdenum){

float aver, sumaII, sumaIII = 0,sumaI = 0;
double stdfi;
for (int c = 0; c < numdenum; c++){

sumaI += arre[c];
}

aver = sumaI / numdenum;

for (int i = 0; i < numdenum; i++){

sumaII = arre[i] – aver;
sumaIII += pow((sumaII), 2);
}

stdfi = sqrt((sumaIII / numdenum ));

return stdfi;
}
int main (){

do{

cout << “Type the number of numbers that you want to have: “;
cin >> y;

const int numNumbers = y;

float x [numNumbers];

for (int i = 0; i < numNumbers; i = i + 1){
cout << “Provide the number ” << i + 1 << ” number: “;
cin >> x [i];
}
cout << “The total of your numbers is:

Continue reading “Standard deviation calculator”

Lists

This program ask the user has to give 10 number and the program have to calculate the total, the average and the standard deviation. I know not all the people knows what is the standard deviation so, for your help and you to understand it, I leave you a link to a webpage for you to read a little about the standard deviation.

So here is my code in Atom list

list1

And this is how the program must work

list2

Also you can check out my on code here on Github.


Lists -.-

En esta ocasión cree un programa que pedía al usuario 10 números que podían ser enteros o incluso con decimales (sin importar), así mismo tuve que crear tres funciones las cuales una era para calcular el total de dichos números, la segunda hacia el calculo para obtener el promedio de esas cantidades y al final en la tercera función se realizaba una desviación estándar de esos números dados. Si no se sabe qué es o cómo funciona esa “desviación estándar” tranquil@, al principio también yo no tenia NPI de que era, aquí esta una definición de ésta (al final de esta publicación les dejare algunos materiales que me sirvieron de apoyo para lograr llevar a cabo este programa).

La desviación estándar o desviación típica es la raíz cuadrada de la varianza.

Es decir, la raíz cuadrada de la media de los cuadrados de las puntuaciones de desviación.

La desviación estándar se representa por σ.

2016-02-24

Si sigues sin entender aquí esta un ejemplo de como obtener la desviación estándar.

2016-02-24 (1)

Así es, la desviación estándar de esos números es 3.87.

Entendiendo estos conceptos procedemos con nuestro código 😉

Lists_1.png

Lists_2.png

Ejecutándolo

Lists_3

Hubo materiales que me sirvieron como guía durante la realización de mi código, aquí les dejo un vídeo de YouTube que me sirvió demasiado y una pagina sobre desviación estándar.

https://www.youtube.com/watch?v=jMOwnFXz2lc

http://www.ditutor.com/estadistica/desviacion_estandar.html

De la misma manera en el siguiente link de GitHub les dejo el código de mi programa.

https://github.com/Ssas69/WSQ10/blob/master/lists.cpp

Espero les sirva de ayuda!! 

ba0b44ceb4c363f582fdb507f0104071

¿Listos? #WSQ10

Ahora empezamos a ver otra forma de datos un poco más complejos de los que hemos visto con anterioridad, estoy hablando de tipos datos complejos que admiten una colección de datos. Aunque son 3 tipos, sólo vamos a hablar de las listas por el momento. Las listas son variables que permiten almacenar varios datos que pueden ser modificados en cualquier momento. Un ejemplo es el siguiente:

mi_lista = ['cadena de texto', 15, 2.8, 'otro dato', 25]

Para acceder a los datos que están contenidos en la lista sólo seleccionamos su número de índice. Estos inician de izquierda a derecha y comienzan por el 0.

print mi_lista[1]   # imprimirá 15
print mi_lista[1:4] # imprimirá 15, 2.8 y 'otro dato'
print mi_lista[-2]  # imprimirá 'otro dato'

La tarea consistía en pedirle al usuario 10 números del tipo flotante para posteriormente utilizarlos para encontrar el promedio, la suma y la desviación estándar. Y lo que hice para satisfacer todas estas condiciones esta aquí:

2016-02-23 (2).png

Podemos notar que utilicé una de las librerías de Python: statistics. Lo que esta función me permite utilizar es una amplia gama de funciones matemáticas que tienen que ver con la estadística y las que necesité para este código fueron:

statistics.mean(datos) # Esta función permite encontrar el promedio.
stdev()  # Esta función permite encontrar una muestra de la desviación estándar.

Y en fin, de esto se trató mi código. Una vez ejecutado esto es lo que pasa en la consola:

2016-02-23

A continuación adjunto mi código en GitHub.